blog
5 Steps To Create High-Quality Infographics In PowerPoint

More than 65% of B2B markets use infographics in their marketing content. More than 91% of customers like visual content over traditional text commands, according to a report by Forbes. Visual representation plays a huge impact in marketing.
The data above explains the role of infographics in conveying your message to the audience in the most effective way.
And why not? Infographics are a great way to tell your message in a crisp and highly interactive manner. It makes your information more interesting and engaging.
For example, an individual would prefer to see an infographic rather than read 10 pages.
Want to create high-quality infographics in PowerPoint? Hiring a presentation design services agency is the best approach. These specialized agencies are market experts committed to creating infographics for various marketing campaigns.
However, we are sharing the 7 essential steps to create effective infographics in PowerPoint.
Step 1: Choosing A New Slide
Open a new or blank presentation in PowerPoint. Choose a new slide and change its orientation to portrait. However, different B2B platforms have different sizes. So, consider before making your infographics live.
Step 2: Adjusting The Size
Resize the slide according to your requirements, you can choose any size between 7.5 width and 13.33 height and select the orientation mode. For infographics, generally, the portrait is preferred.
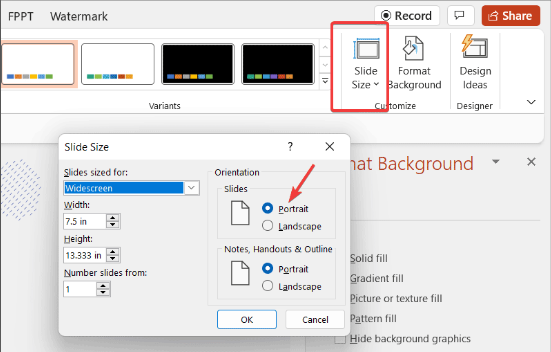
Image Source: Free PowerPoint Templates
Step 3: Selecting Icons for Infographics
This opens a new page from where you can start creating infographics. You can use a drawing function to convert text into images and add images.
Go to Insert insert>Choose Icon> Icon with various categories appears
In addition to icons, you can choose from a large collection of graphics assets, including illustrations, images, videos, stickers, etc.
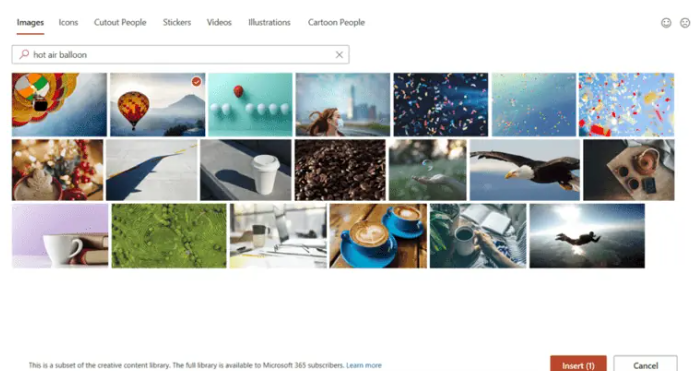
Image Source: Simon Sez It
Step 4: Choosing a Content Theme
Choose a desired theme once the infographic is complete. You can get the option to choose from various backgrounds and content themes.
Step 5: Save File In PDF Format
Once all the changes are made, save the file in PDF format.
Remember, choose the lowest possible size if you want to upload the file online.
Select Files> Save As> PDF> Ok
Formatting a Background For an Infographic
These were some of the easy steps to create a simple yet attractive infographic in PowerPoint.
However, if you want more depth in your graphics, you can format the original background and fill it with different colors and styles. It depends on the type of graphics and what type of services you direct to the audiences.
To format the background,
- Right-click on any empty area on the graphic slide.
- Select the format background option
- A panel fill appears on the screen including Solid Fill, Gradient Fill, Pattern fill, etc
- Choose any background that matches the tonality of your infographic
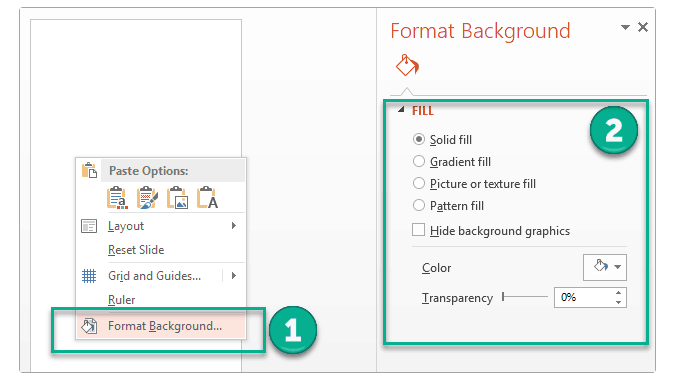
Image Source: 24Slides
Powerpoint Smart Art: Creating Smart Graphics
Well! Powerpoint gives you the flexibility to create smart art infographics by offering custom shapes and vector graphics.
For creating quick B2B infographics, this tool provides you with responsive graphics to create some good fonts with your message.
To design a smart art,
- Click on ‘Insert’ on the main PowerPoint interface
- Select smart art from the tool panel
- Either choose design or format tab
- Choose from a list of smart art graphics based on the subject of your infographic.
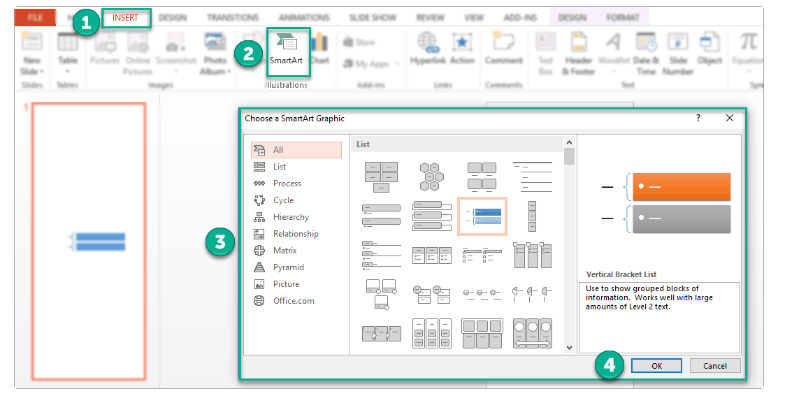
Image Source: 24Slides
Types Of Infographics in PowerPoint
We have talked about the structure and the design element of how to create infographics in PowerPoint. However, you need to consider which type of infographic you consider that matches your service offerings.
Hiring a presentation design services agency to help you develop strategies to convert your visual data into a high-quality infographic.
Here are some of the basic types of infographics used for B2B presentations
2 sided Comparison
Two-Sided Comparison
This format is commonly used to highlight the differences between your products or services and those of your competitors. You can select a template layout that best suits the details you want to present.
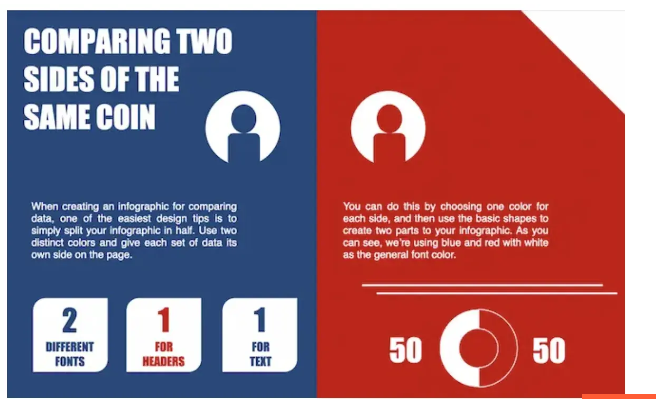
Image Source : Hubspot
- Compare Product Offerings
- Outline the Pros and Cons of a Specific Service
- Display Information in a Chronological Order
2. Flowchart Infographic
Use a flowchart infographic to show how the industry works. It is ideal if you have introduced a new flow in your organization.
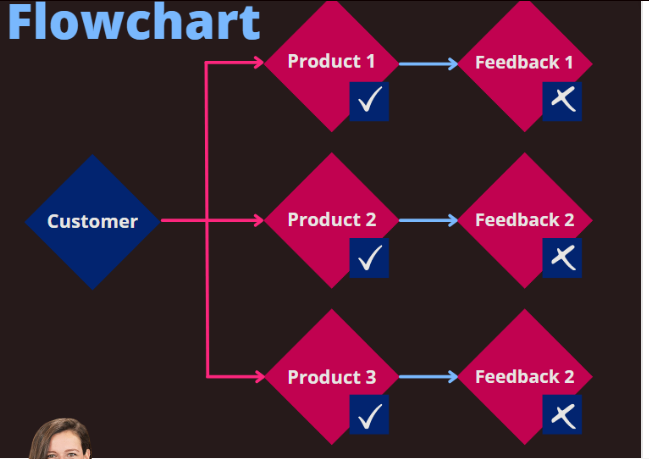
Image Source: The Hoth
B2B businesses can drive a customer flowchart showing various product lines and customer feedback on that.
3. Timeline Infographic
Timeline Infographics are a great way to represent a chronological story using various timelines to display business reports, history, etc.
According to a study by HubSpot, 45% of marketers believe that infographics are the most effective way to deliver your message to your target audience.
Take a look at what timeline infographics look like:
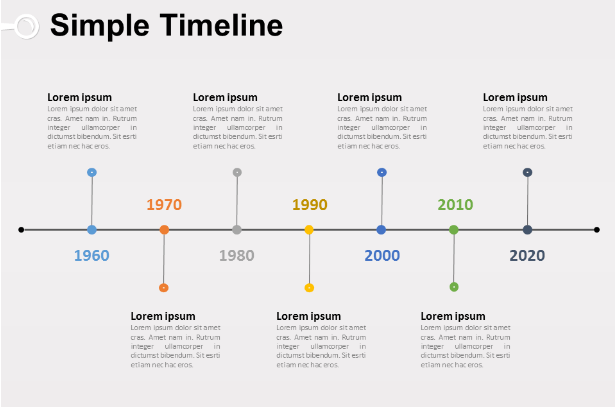
Image Source: Presentation Go
4. Image Heavy Infographics
With the latest design templates, you can create images that focus on exact information rather than telling a story in numbers and figures. This is specially designed for B2B businesses to compare different types of information in one single image.
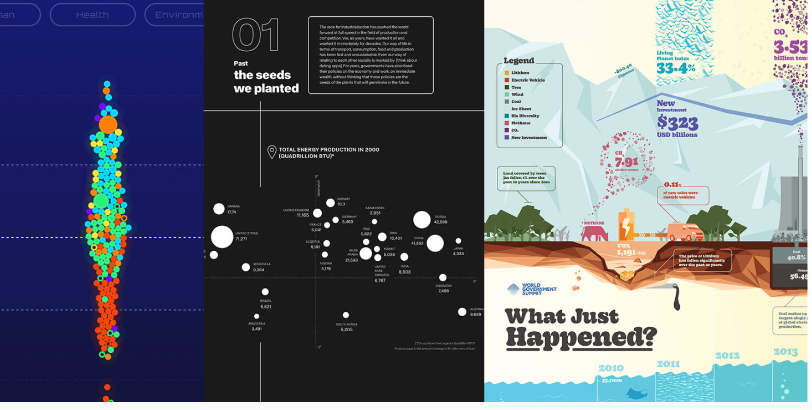
Image Source: shutterstock
These infographics also use various shapes, designs, and photography elements to tell a complex story most effectively.
- You can add logos, header, footer, and shareable links to your desired social media pages.
Essential Tips For Creating attractive B2B infographics
Before analyzing any type of infographics, you need to consider a few things that will help you in generating infographics as per your business offerings
- Clarify the purpose by outlining every detail of your infographics such as your target audience, the purpose of the infographic is for promotional purposes. A new product offering?
- Choose the right font and colors. It is advisable to use 2 fonts, one for the header and one for the middle story information.
- Do not go beyond 3-4 colors, use combinations among them to create colors that match your brand identify
- Include your business logo and tagline to highlight the title
- Better to add a social media link to promote your offerings. You can also use a call to action button.
Final Takeaways
Creating an infographic in PowerPoint is not as easy as it sounds. You need to have an eye for creativity and design every detail with perfection.
Whether you are a small startup or a big name in the B2B sphere, including infographics in your marketing strategy helps you gain high user engagement.
Choose Tangence, your one-stop solution for all presentation design services.